Designed for traders and punters
The biggest benefit of this approach is, if you are time constrained these are set and forget bets. The historic profit values are based on placing a bet and letting it run.
Finding the edge in efficiently priced markets.
Let"s start off with what it isn't!. It s not a money printing machine and it is not a crystal ball. It is not going to help you win 100% of the time. What it can do is identify markets where historically, certain price bands for specific markets have provided an edge. This isn t some trick, or hack. It is not exploiting any loopholes either. On exchanges markets are typically priced efficiently, which means the price reflects what punters/traders expect to happen.
The biggest benefit of this approach is, if you are time constrained these are set and forget bets. The historic profit values are based on placing a bet and letting it run.
The pivot tables can quickly show you for a number of leagues and seasons what are potentially profitable price points. The charts can show you an actual running total so you can see if the trend is increasing or declining.
Work will be ongoing to add new features to continually improve the solution. New statistics as well as more detailed fixture stats will be added soon.
Don t want to pour through the pivot tables and charts? No problem, our free telegram channel sends out alerts where markets are within an indentified price range one hour before kick-off. Completely FREE, join here.
All Betfair pricing that is obtained is stored so actual performance can be tracked for each market and price band. This can help determine if certain leagues for a specific market are more profitable than others.
The pivot tables are your starting point. Just following this link and you can see the price for backing the home team.

You can see a list of leagues shown down the left hand side and price bands across the page. Where a particular price range has been profitable for a league you will see those cells shaded in a different colour. By default the data shown is for league seasons 17/18 onwards. However if you click on the season button you will see:
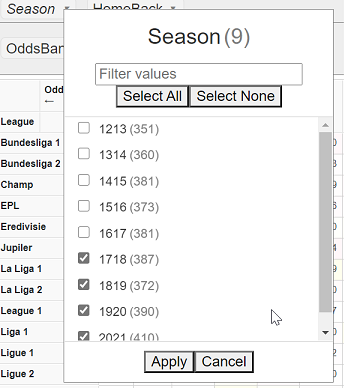
and you can select more or less seasons data.
So the grid shows us historically profitable price ranges. If we click any cell in the grid then we will see a charts for the specified league, season(s) and price range.
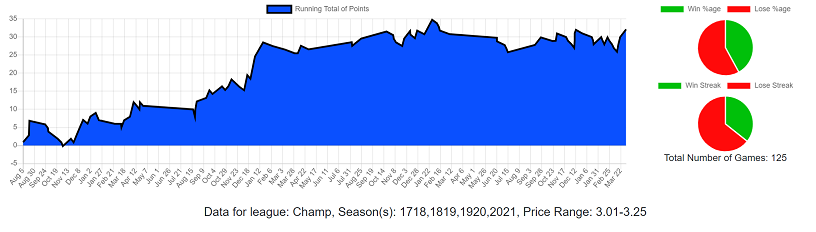
So the chart shows us how profitable betting in the English Championship on a home win where the home team is priced between 3.01 and 3.25 is over time. We can see that the chart shows a steady growth. Additionally the two smaller pie charts show how many times this bet wins and loses and what the longest winning and losing streaks are. We can also see the total number of games, a useful metric as you may have a profitable range and, certainly with the higher odds prices very few qualifying bets.
Contrast this with backing the home team in the English Premier League priced between 4.01 and 4.25 which shows a profit of 14.63 points it looks like:
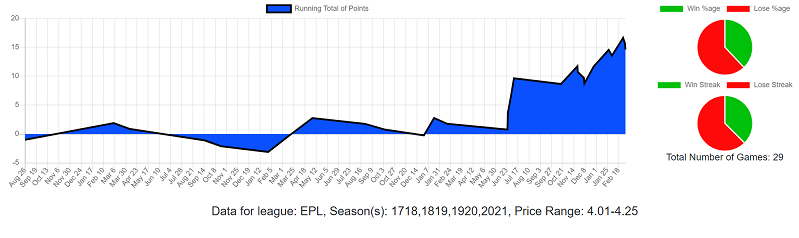
So its only become profitable of late.
Having identified historically profitable price ranges for specific markets and leagues these are put into a watch list . Then a process grabs Betfair data every 30 minutes and if there are any markets that meet the criteria these get added to a potential bet list. Then once a day another process collates the results to see if those games were actually profitable. Just click on the Actuals tab within the application see this. The drill down performs the same way is it does for the historic data; click on an cell.
Receive notifications to your mobile or desktop via Telegram when markets are priced within a historically profitable range. If viewing on mobile simply click the link in the message and it will take you to the actual market on the Betfair app!
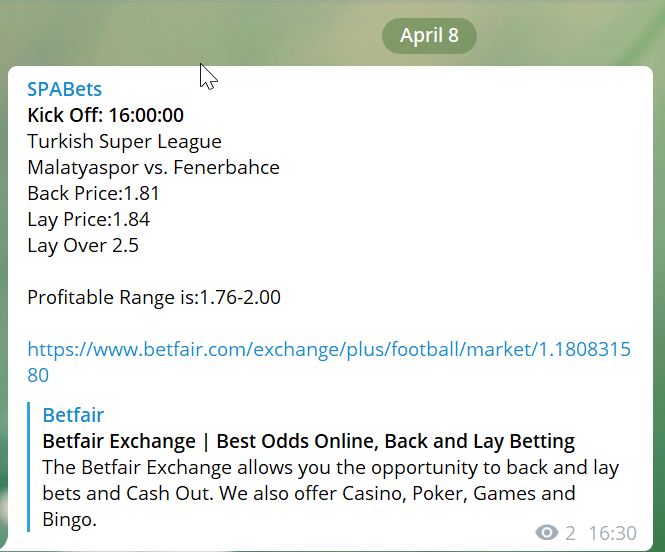
Please use Telegram
![]()